Authors: Vidhisha Balachandran, Jingya Chen, Lingjiao Chen, Shivam Garg, Neel Joshi, Yash Lara, John Langford, Besmira Nushi, Vibhav Vineet, Yue Wu, Safoora Yousefi
Do reasoning capabilities of large reasoning models extend to complex reasoning skills beyond math? What is their advantage when compared to conventional, autoregressive models? What is left to harvest in the reasoning space and how far can we go from here? Do longer and extended CoT scratchpads always translate to higher accuracy? This blog summarizes answers to these questions by using insights from the recent Eureka report on inference-time scaling: “Inference-Time Scaling for Complex Tasks: Where We Stand and What Lies Ahead (opens in new tab)”.
For extracting these insights, the study uses experiments on eight diverse complex reasoning tasks on nine state-of-the-art models at the frontier of Artificial Intelligence today. The tasks include:
- Math reasoning (Benchmarks: AIME 2025, AIME 1983-2024, OmniMATH)
- Science reasoning (Benchmarks: GPQA)
- Planning and scheduling (Benchmarks: BA Calendar)
- NP-hard algorithmic reasoning (Benchmarks: TSP for traveling salesman minimal paths and 3SAT on 3-literal satisfiability)
- Spatial understanding (Benchmarks: Spatial Understanding and Maze)
All these tasks were used to test conventional models like: Claude 3.5 Sonnet, Gemini 2.0 Pro, GPT-4o, and Llama 3.1 405B, as well as reasoning models: Claude 3.7 Sonnet, DeepSeek R1, Gemini 2.0 Flash Thinking, O1, and O3-mini.
To estimate the future potential of all models we ran all experiments several times following two different scaling approaches. In the parallel approach, we make N independent calls to the model and aggregate the results via different aggregators: average, majority vote, best of N, worst of N. In the sequential approach, the model is set to sequentially attempt to solve the problem and if it is incorrect, it receives feedback from another model inference call until the context budget is exhausted or N trials are done.
All experiment implementations and data are available on Eureka ML Insights (opens in new tab), which is an open-source framework for standardizing evaluations of large foundation models, and for extracting insights beyond single-score reporting and rankings.
Finding 1: There exists a large gap between conventional models and models trained for inference-time compute (aka reasoning models) on complex tasks, indicating a major update on the state of the art. Improved reasoning also extends and generalizes to algorithmic and planning problems beyond math.
In math benchmarks, reasoning models surpass their conventional counterparts often by more than 50 percentage points in accuracy. It is also interesting to see major improvements in algorithmic problems such as NP-hard problems like Satisfiability (3SAT) and Traveling Salesman Path Optimization (TSP), as well as calendar planning. Improvements in spatial understanding (Maze and SpatialMap) and scientific reasoning however are less pervasive across model families but still often over 20 percentage points.

Finding 2: The effectiveness of inference-time scaling varies between domains and tasks, with diminishing returns as task complexity increases.
As shown in Figure 2, an in-depth analysis on the GPQA benchmark for scientific problems, reveals that while reasoning models all achieve an accuracy of higher than 90% for Physics, they still lag behind on Biology and Chemistry. In algorithmic problems and other problems that have a notion of difficulty, model accuracy drops even for the best models as difficulty increases and the length of reasoning traces saturates.

Finding 3: A reasoning model that uses more tokens for a given problem is not always the most accurate one. Even for the same model, longer generations are on average less accurate than the shorter ones.
There is high variability in token use, even across models with similar accuracies on a task. For example, in Figure 3, we can observe that often there exist pairs of models that have similar accuracy but one of them uses a lot more tokens (e.g. for AIME 25, DeepSeek-R1 and Claude 3.7 Sonnet Thinking have an average accuracy across five repeats within a < 3% range, but Claude 3.7 Sonnet Thinking uses at least 2.5 times more tokens).

Figure 4 illustrates the average accuracy over generation lengths for the DeepSeek R1 model and O3-mini high on the GPQA task.


Finding 4: Repeated queries to the same model can yield highly variable token usage, introducing cost nondeterminism for developers and users- even when the model consistently provides correct answers.
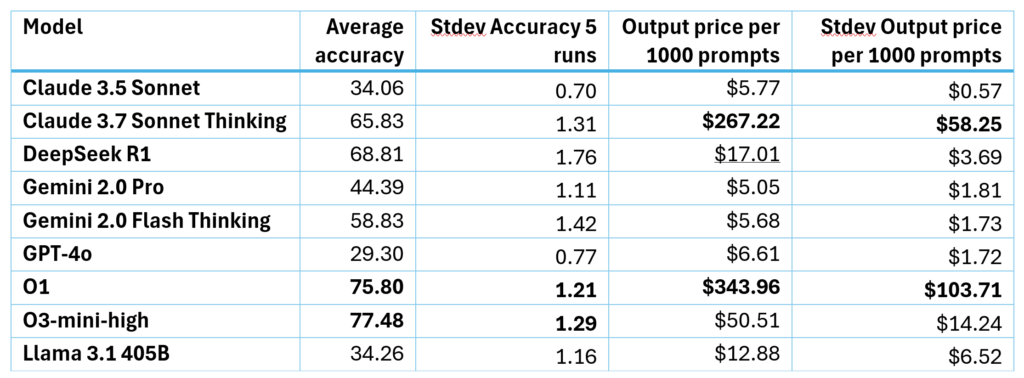
Horizontal whiskers in Figure 3 are a measure of cost nondeterminism as they show the variability within a single prompt (data instance). In Table 1, we summarize these charts and show the actual cost in dollars on average for 1000 prompts, with today’s prices per provider. This shows that the variability on token length can translate to up to 40% variability in actual cost for almost all reasoning models.


Finding 5: There exists untapped potential for improving both conventional models and models trained for inference-time compute.
To conduct this analysis, we run all our experiments 5 times and see whether a correct inference path exists by checking with a “perfect” verifier which has access to ground truth. See examples of results in Figure 6. The existence of the inference path shows that it is possible to extract that skill or knowledge from the model with better fine tuning and RL techniques. This emphasizes the importance of building improved and generalizable verifiers that can be used for further development. In fact, investments in better verifiers for different domains can become the distinguishing factor in the current AI space that determine the speed of progress in generalizing reasoning for a broad number of use cases.

Finding 6: Current reasoning models (in our case O1) improve more efficiently upon receiving feedback on their solutions than conventional models on the most complex tasks.
Figure 7 shows results on experiments that simulate sequential iterations on O1 and GPT-4o, where the model first attempts a solution and then receives feedback from another judge (of the same type) to make another attempt on the solution, if the previous one was incorrect, until the context length is depleted. Here, O1 improves much faster than GPT-4o, and its improvements are even faster with sequential feedback.


