
Text-to-Viz
DO YOU KNOW
 |
People remember 80% of what they see, only 20% of what they read |
 |
An infographic is 30x more likely to be read than pure text |
 |
People are 17% more likely to be persuaded by imagery content |
PROJECT DESCRIPTION
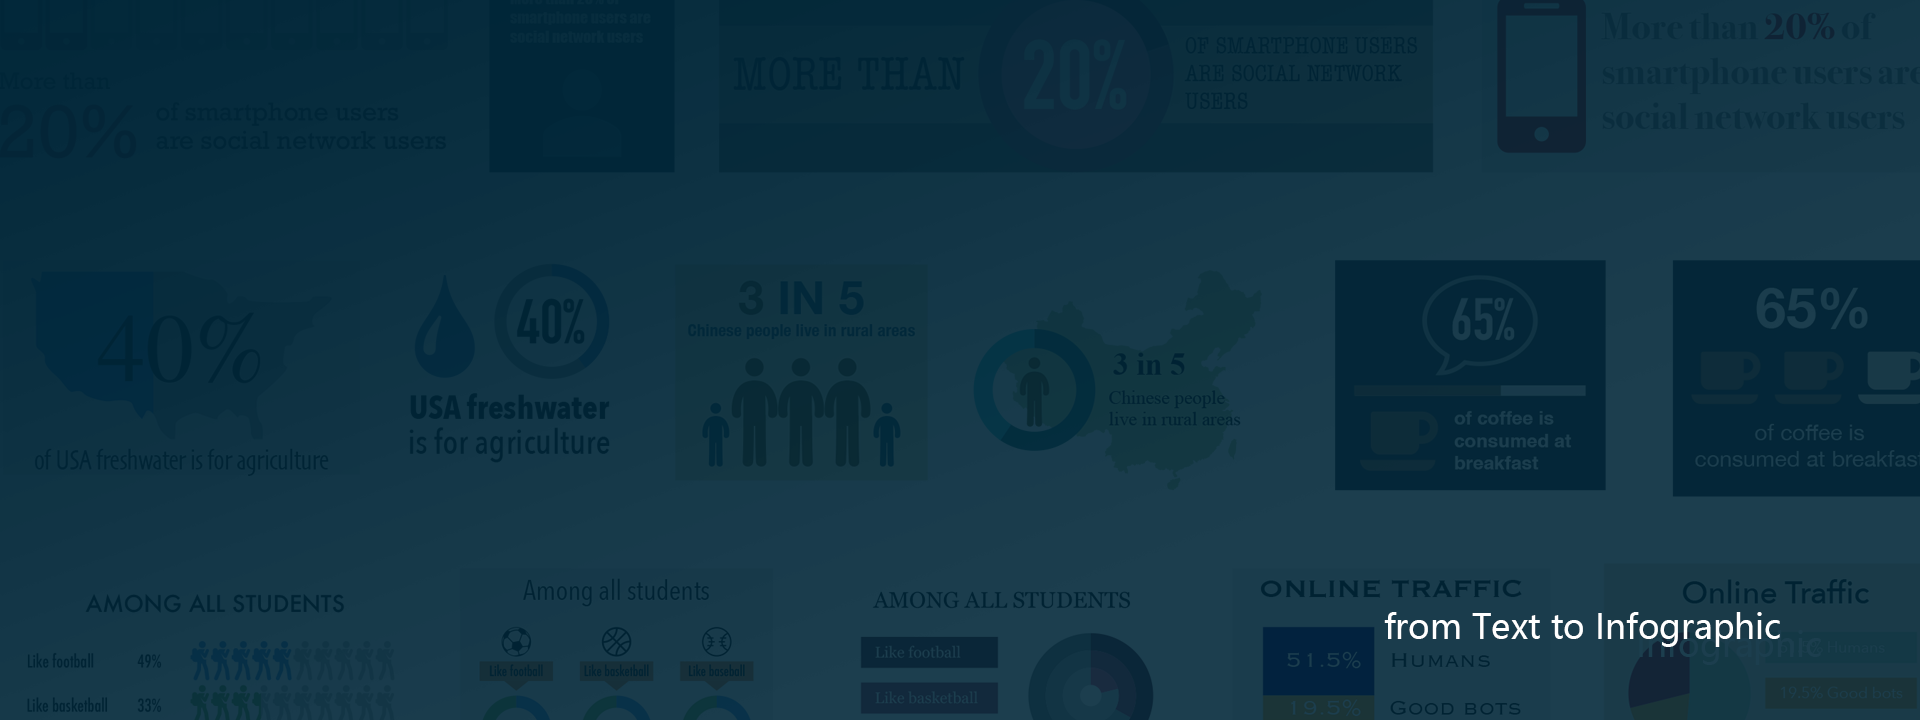
Information graphics (infographics) can effectively deliver messages in an engaging and memorable fashion. Hence, they have now gained tremendous popularity in presentations, documents, dashboards, etc. However, as a task usually requiring high-level design creativity and good proficiency with graphic design tools, authoring a professional infographic remains a challenge for information workers. We proposed Text-to-Vis to lower the access barrier for them, as well as to unleash and inspire their creativity. With natural language statements as input, Text-to-Vis can automatically generate a diverse set of infographics that can well convey the information in the text. Text-to-Vis allows information workers to achieve expressive and compelling infographics effortlessly, and use them to enhance and enrich their presentations and documents.
APPROACH
STATEMENT |
TECHNOLOGY |
INFOGRAPHICS |
||
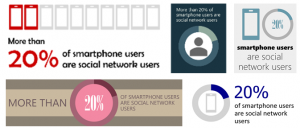
“More than 20% of smartphone users are social network users” |
 |
Natural language analysisVisualization synthesis |
|
 |
EXAMPLES
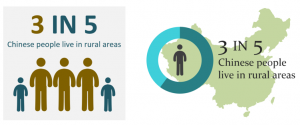
3 in 5 Chinese people live in rural areas
76% of students find math difficult
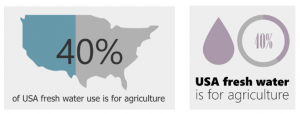
40% of USA fresh water use is for agriculture

人员
Weiwei Cui
Researcher
Ray Huang
Research SDE
Yun Wang
Senior Researcher
Lei Fang
Senior Researcher
Jian-Guang Lou
Sr. Principal Research Manager
Haidong Zhang
Principal Architect
Dongmei Zhang
Distinguished Scientist, Deputy Managing Director, Microsoft Research Asia